
- Understanding Scalping Indicators
- Moving Averages
- Relative Strength Index (RSI)
- Bollinger Bands
- Stochastic Oscillator
- Moving Average Convergence Divergence (MACD)
- Combining Indicators for Scalping Strategies
- Common Challenges When Using Indicators in Scalping
- The Bottom Line
- FAQ
Scalping is a trading style based on frequent transactions within short timeframes, often lasting only a few seconds or minutes. The objective is to capture small fluctuations in price that occur during active market conditions. To manage such rapid decision-making, traders look for tools that can help them catch minor price changes. Technical indicators are among them. They can provide structured signals for entry and exit points. This article outlines the indicators frequently used in scalping and describes how they are applied in intraday trading.
Understanding Scalping Indicators
As you may know, scalping is a trading strategy where traders aim to take advantage of small price movements by executing numerous trades within short timeframes, often closing trades within a few minutes. This approach requires swift decision-making and precise timing.
Technical indicators may be important tools in this context, as they provide real-time data and insights into market trends, momentum, and volatility. Using these indicators, traders can identify optimal entry and exit points, potentially enhancing their ability to navigate the rapid pace of the market.
Below, we’ll break down five indicators for scalping. You’ll find these scalping indicators in MT4 and MT5, and TradingView. Also, you can get started in seconds with FXOpen’s TickTrader trading platform.
Moving Averages
Moving averages (MAs) are considered by some to be the most popular indicator for scalping, smoothing out price data to help identify trends by calculating the average price over a specific period. In scalping, where quick decisions are crucial, certain types of moving averages can be useful.
Exponential Moving Average (EMA)
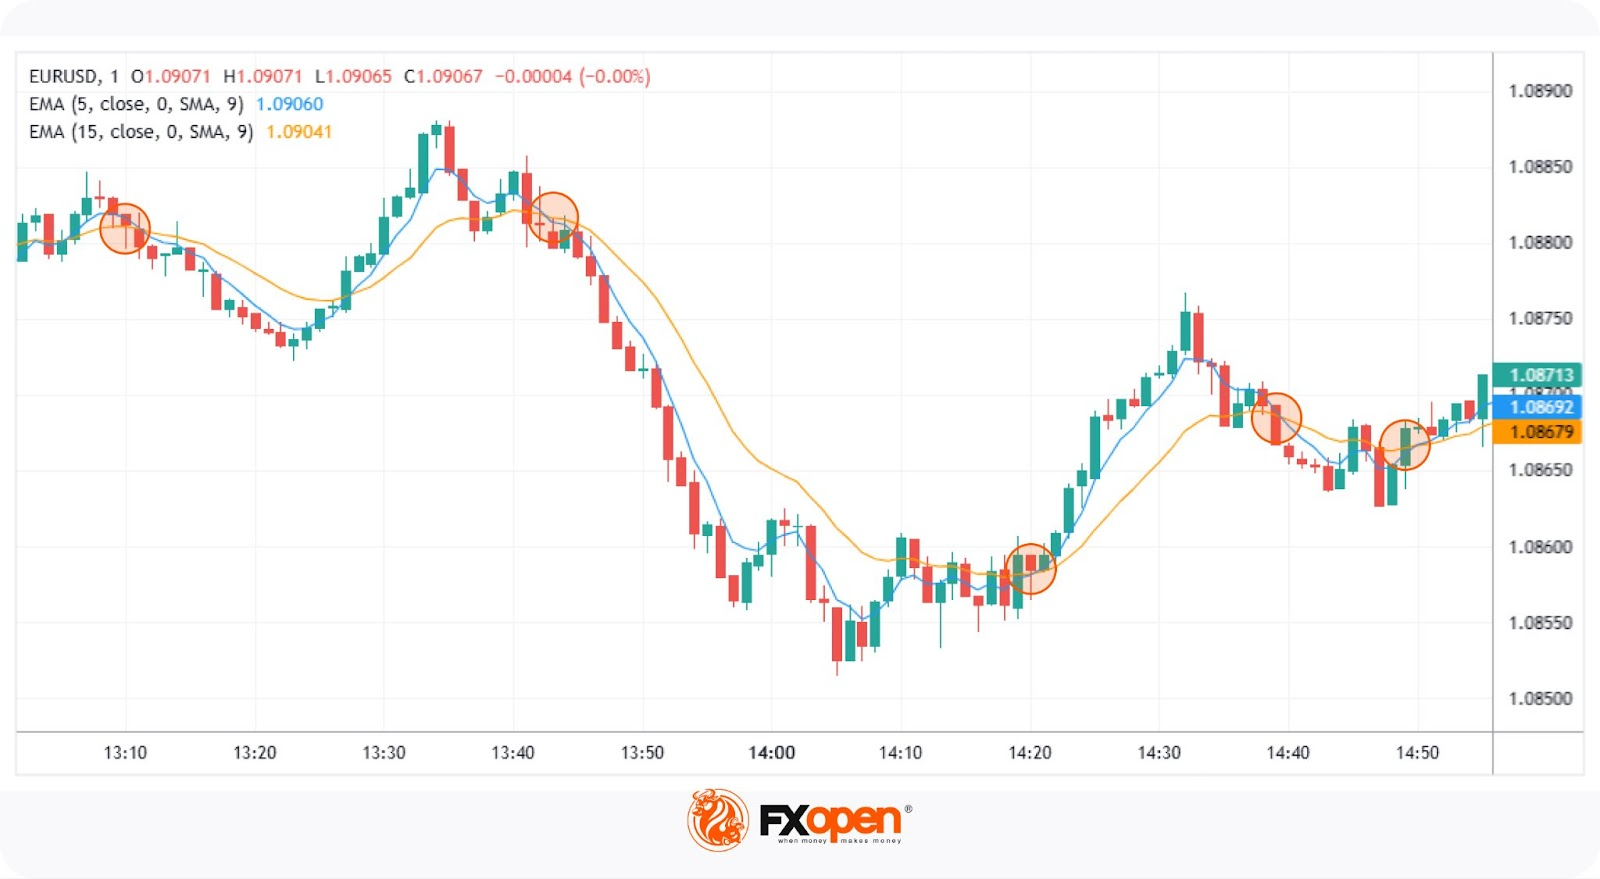
Unlike the Simple Moving Average (SMA), which assigns equal weight to all data points, the EMA gives more significance to recent prices, making it more responsive to current market movements. This responsiveness is advantageous for scalpers. For instance, a 9-period EMA reacts swiftly to recent price changes, potentially providing timely signals for entry and exit points.
Hull Moving Average (HMA)
Developed by Alan Hull, the HMA further reduces lag and enhances smoothness compared to traditional moving averages. It achieves this by weighting recent prices more heavily and using a unique calculation method. The HMA’s ability to closely follow price action while minimising lag makes it a valuable indicator for scalpers.
Applying Moving Averages in Scalping
- Crossover Strategy: Scalpers often use two EMAs of different lengths. A common approach involves a fast EMA (e.g., 5-period) and a slow EMA (e.g., 15-period). When the fast EMA crosses above the slow EMA, it may indicate a bullish trend, suggesting an entry point for a buy trade or an exit point for a short trade. Conversely, when the fast EMA crosses below the slow EMA, it may signal a bearish trend, indicating a potential entry for a sell trade or moment to close a long trade.
- Trend Confirmation: The EMA and HMA can be used to confirm trends identified by other indicators. For example, if the moving average is sloping upwards, it may confirm an uptrend, supporting decisions to enter long positions. If it’s sloping downwards, it may confirm a downtrend, supporting decisions to enter short positions.
You can find these scalping indicators in TradingView and FXOpen’s TickTrader trading platform.
Relative Strength Index (RSI)
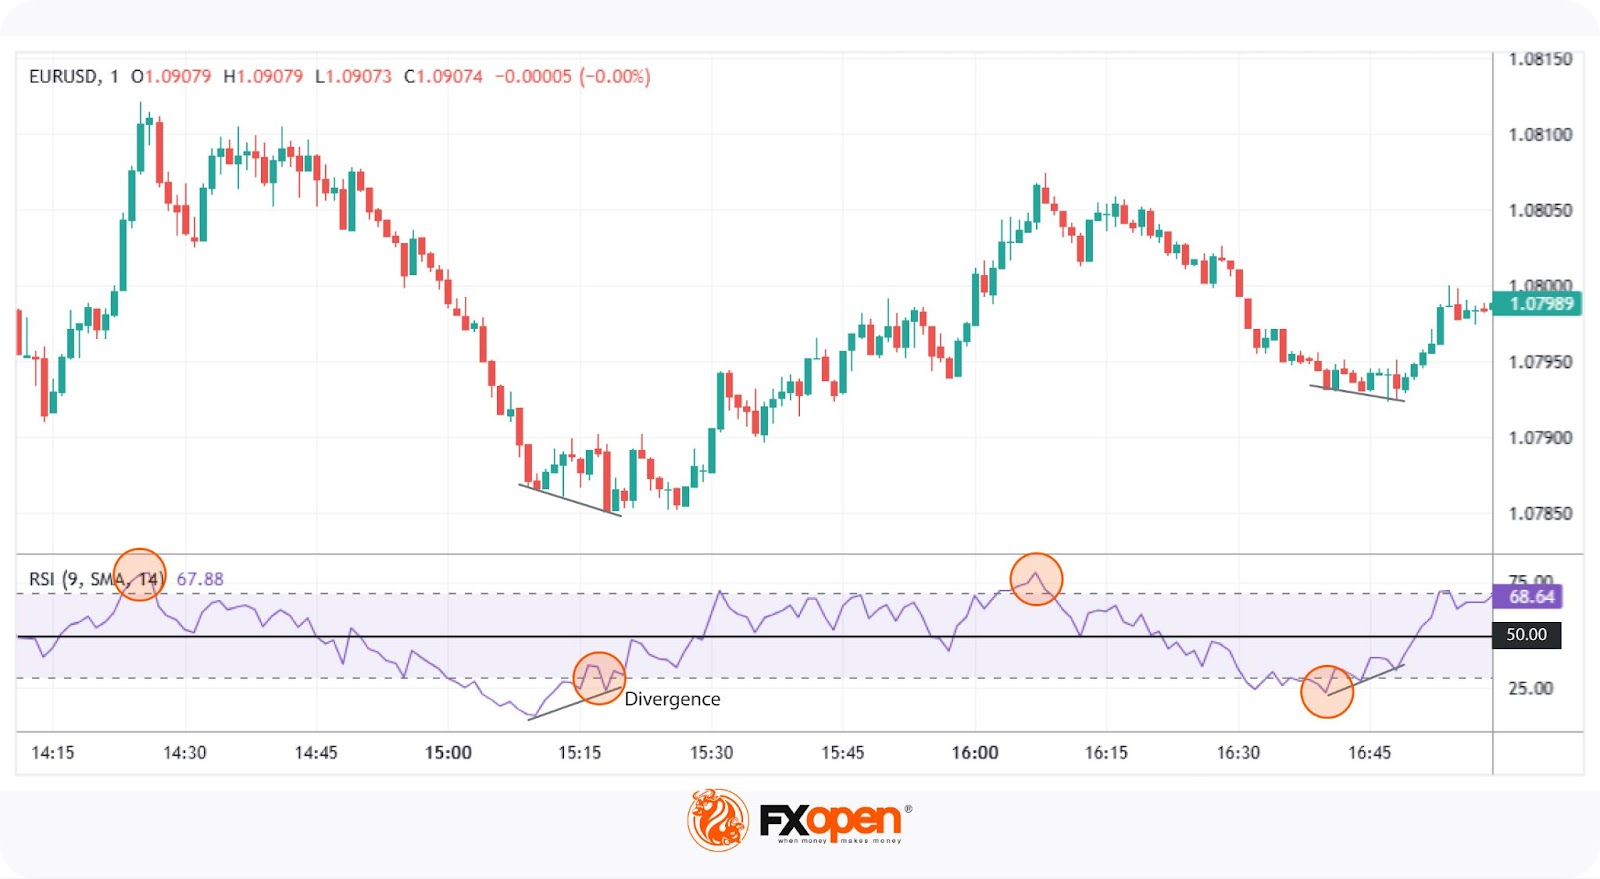
The Relative Strength Index (RSI) is a well-known scalping indicator that measures the speed and change of price movements, oscillating between 0 and 100. Traditionally, an RSI above 70 indicates overbought conditions, while below 30 suggests oversold conditions.
In scalping, traders often adjust the RSI from its typical length of 14 to shorter periods, such as 7 or 9, to capture rapid price swings occurring over minutes. This adjustment makes the RSI more sensitive to recent price changes, providing timely signals for quick trades.
Applying RSI in Scalping
- Overbought/Oversold Levels: When the RSI moves beyond 70 or drops below 30, traders watch for potential reversal points. However, scalpers may focus on the RSI’s movement back into the 30-70 range as an early sign of momentum shifting.
- Divergences: Scalpers also look for divergence between price movement and the RSI. For example, if the price reaches a new high but the RSI does not, it may signal a weakening trend and possible reversal. This divergence may support traders in anticipating quick market shifts.
- Midpoint (50 Level): The 50 level serves as a midpoint, indicating the balance between gains and losses. An RSI crossing above 50 may suggest bullish momentum, while dropping below 50 can indicate bearish momentum. Scalpers use this midpoint to assess the prevailing market trend.
Bollinger Bands
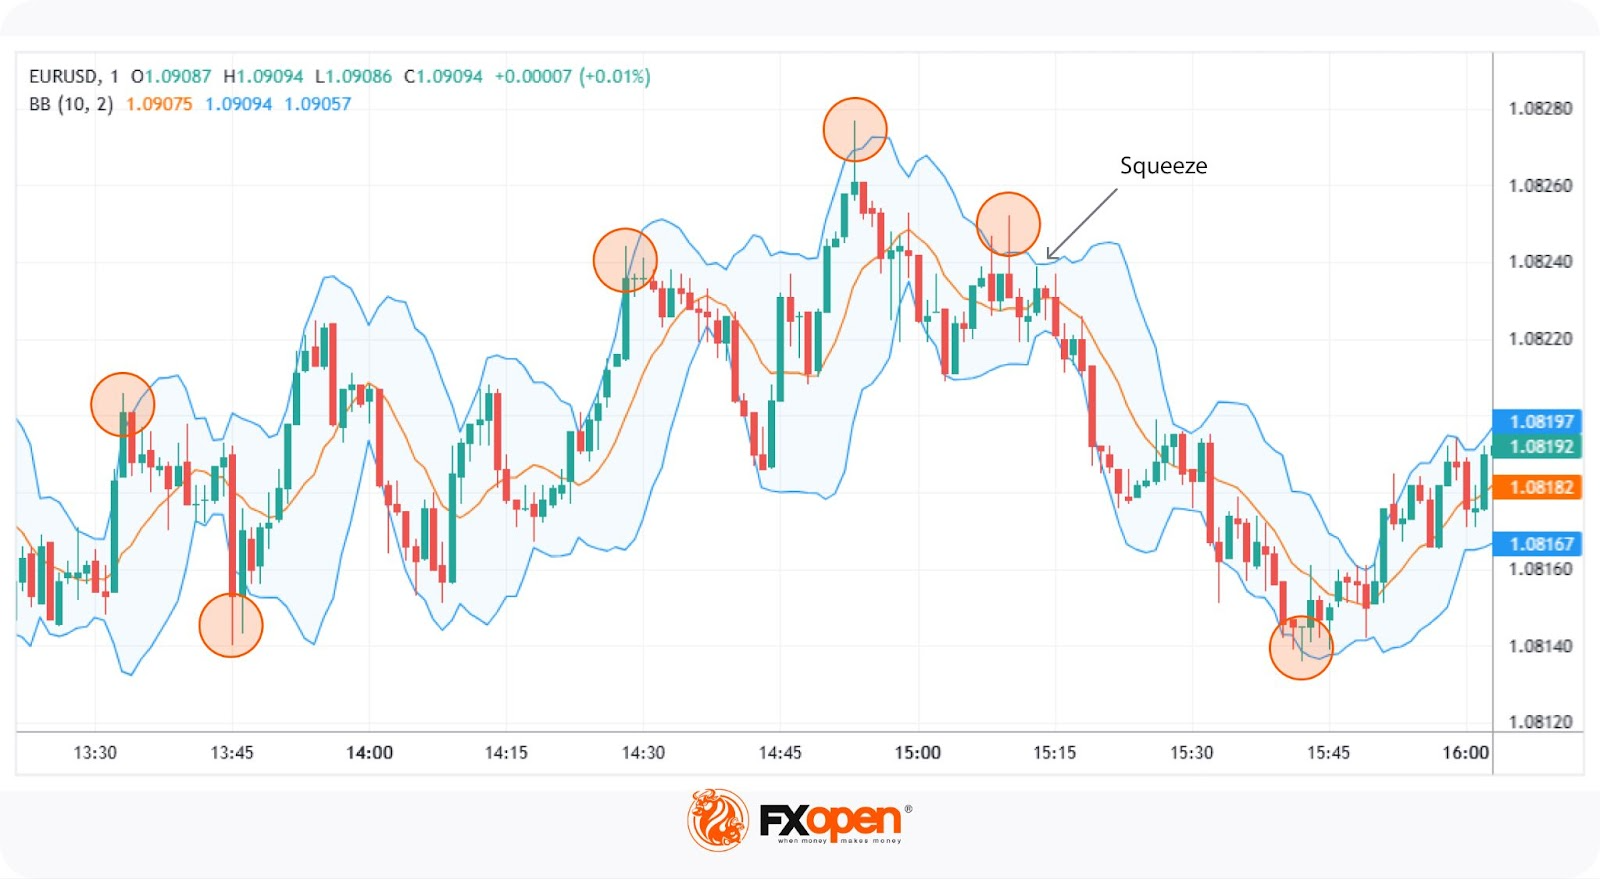
Bollinger Bands are a technical analysis tool comprising three lines: a simple moving average (SMA) in the middle, with upper and lower bands set at a specified number of standard deviations from the SMA. These bands expand and contract based on market volatility, providing a visual representation of price fluctuations.
In scalping, traders often adjust Bollinger Bands to shorter timeframes, such as 1-minute or 5-minute charts, to capture quick price movements. A common approach involves setting the SMA period to 7-10 and the standard deviation to 1.5-2, potentially enhancing sensitivity to short-term market changes.
Applying Bollinger Bands in Scalping:
- Bollinger Squeeze: When the bands contract, indicating low volatility, it often precedes significant price movements. Scalpers watch for a breakout above or below the SMA. When the price breaks above the SMA, it may signal that the price will rise, and vice versa.
- Reversal: Price breaching the upper band may suggest overbought conditions, while below the lower band may indicate oversold conditions. Scalpers use these signals to anticipate potential price reversals.
Stochastic Oscillator
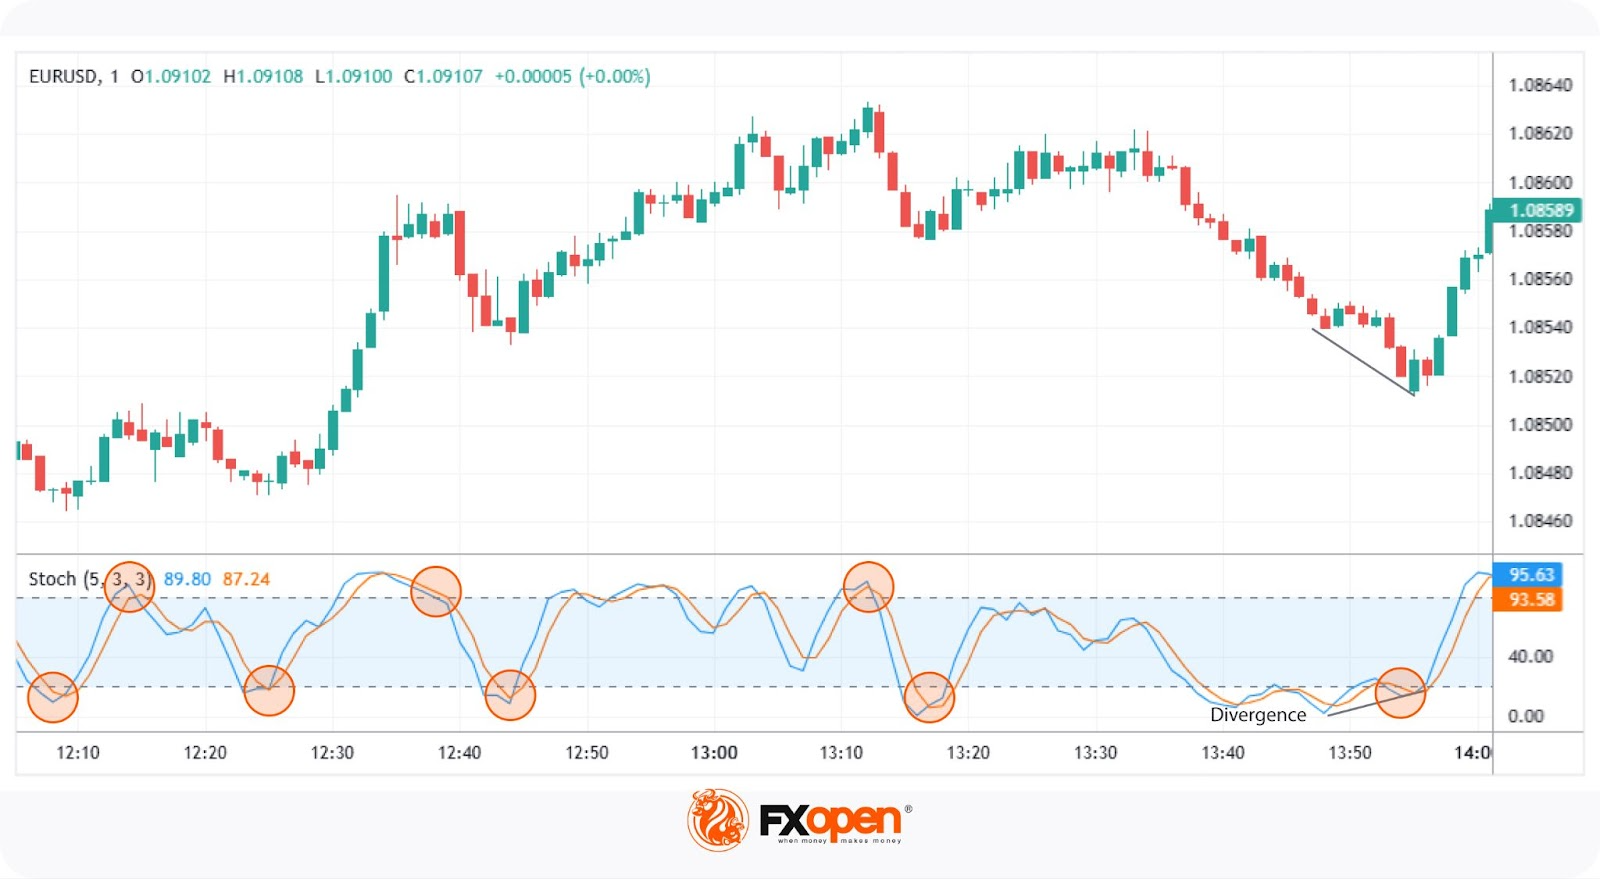
The Stochastic Oscillator is a momentum indicator that compares an asset’s closing price to its price range over a specific period, typically 14. It includes the %K line, the current closing price relative to the range, and the %D line, a moving average of %K. The scale runs from 0 to 100, where readings over 80 suggest overbought levels, and those under 20 point to oversold levels.
In scalping, traders may adjust the Stochastic Oscillator to shorter settings, such as 5,3,3, to increase sensitivity to rapid price movements. This adjustment may help in capturing short-term market fluctuations.
Leave a Reply